
Case Study: assessing weather damage to cereal crops using drones
Introduction
To guarantee the efficacy and safety of biostimulants, fertilisers and crop protection products, field trials are carried out throughout the life cycle of the crop concerned. With this in mind, certified testing centres must carry out various analyses to verify the efficacy of these products and highlight the differences between the different products tested.
For cereal crops grown for forage, among the various parameters to be analysed are the height and biomass of the individual plots. Currently, these parameters are assessed by taking measurements directly in the field: the height of each plot is measured with a standard tape measure, while the biomass of each one is measured by cutting the vegetation and subsequently weighing it. All these methods are localised, subjective (they depend on who takes the measurement) and/or destructive, with high survey costs and times. Using a drone as an agronomic survey and monitoring tool can help technicians assess these and many other parameters more objectively and extensively, such as vegetation and water stress indices. Furthermore, by carrying out multiple flights over time, it is possible to create time series that highlight how the various biometric and biophysical parameters change over time.
Case study
On behalf of a client, we carried out a drone flight over 60 barley plots of around 10 m² each. The flight altitude was set at 30 metres, taking simple RGB photos with 85% frontal and side image overlap.
By analysing the images taken, it was possible to reconstruct the digital models of the plot (DSM and DTM) in which different biostimulant products were being tested. In this way, the biomass volume of each individual plot and the heights at each point were obtained (Fig.1), generating the average height of each plot under trial.
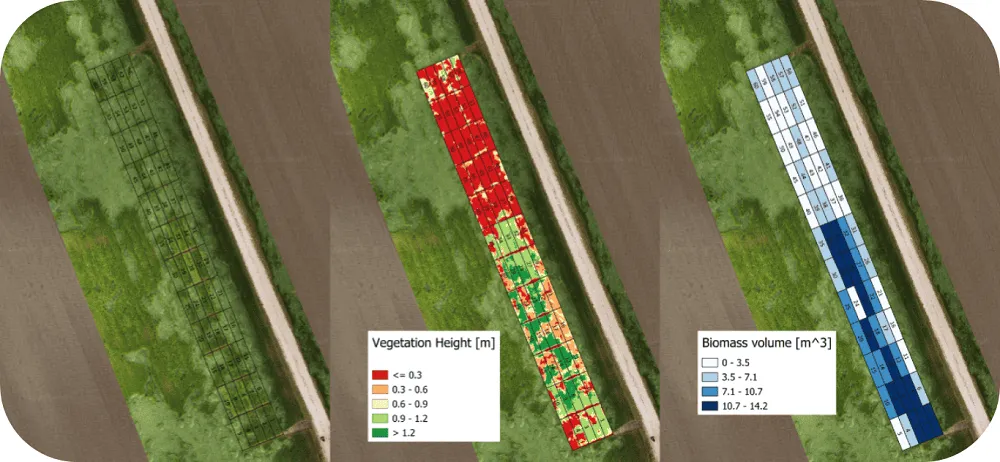
Fig.1: From left to right: RGB map; height map; volume map per plot.
Unfortunately, a few days before the survey, a storm hit the trial field, causing lodging in several portions of the trial. Thanks to the remotely sensed images, it was possible to calculate the percentage of lodging. Indeed, considering any portion of vegetation below 60 cm to be lodged, a “lodging map” was created, which was subsequently used to assess the percentage of lodged barley in each individual plot of the trial (Fig. 2).
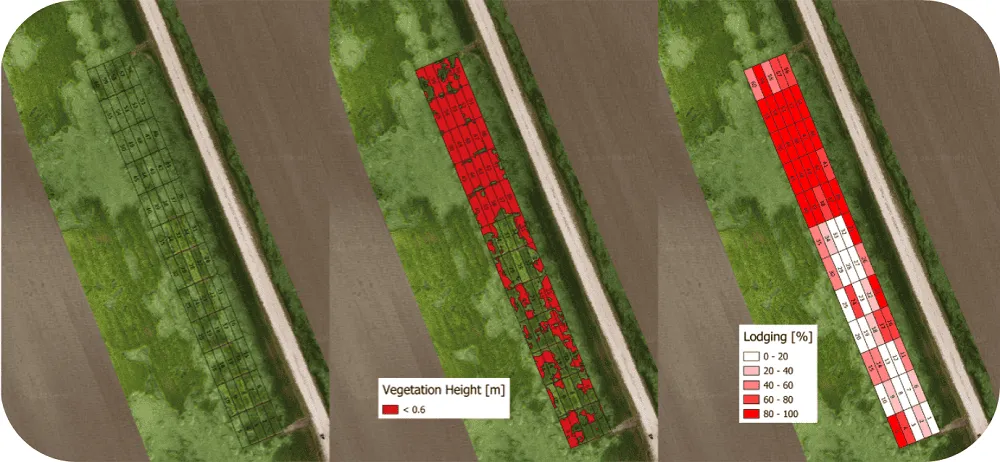
Fig.2: From left to right: RGB map; lodging map; percentage lodging map per plot.
Conclusions
Thanks to the use of drone remote sensing and the processing of the data collected, it was possible to shorten the time needed for field measurements, correctly estimating the heights and volumes of the individual plots.
It should be noted that by carrying out multiple surveys during a growing season, it is possible to build a historical dataset, valid for assessing and giving a concrete measure of how the development of individual plots changes over time.
Furthermore, it was possible to precisely assess the damage caused by the lodging resulting from the weather event that hit the trial, a very useful function for numerically and objectively demonstrating the percentage of damage, both for the farmer and for the bodies responsible for managing agricultural damage (e.g. wildlife).