
Case Study: multi-temporal analysis of trial plots
Introduction
The use of drone remote sensing in agriculture has revolutionised the way crops are monitored and managed. Through these technologies it is possible to acquire high-resolution visible (RGB) and multispectral images and data, covering large areas of land in a short time, enabling fast and accurate field mapping.
A single survey can highlight the characteristics of crops at that particular moment, but carrying out multi-temporal surveys makes it possible to monitor how crops evolve over time, allowing the analysis and comparison of changes in plant conditions, such as growth, biomass volume, vegetative vigour and the presence of disease or stress.
Case study
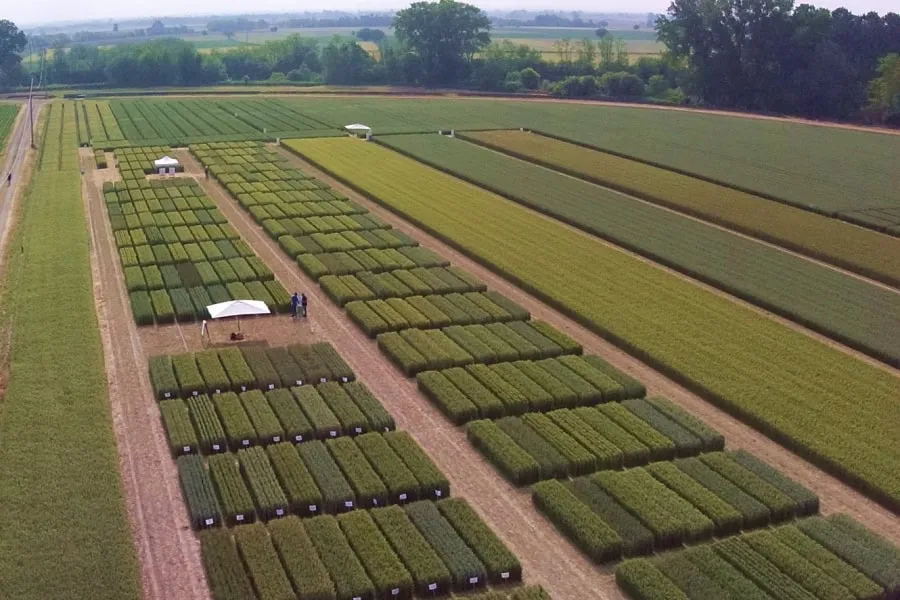
On behalf of a testing centre, multi-temporal surveys were carried out from February to May 2023. Each flight was carried out over 64 wheat plots measuring 3×7 m, each subjected to a different biostimulant treatment. The flight altitude was set at 30 metres, taking RGB and multispectral photos with 85% frontal and side image overlap. By analysing the images taken, it was possible to reconstruct, for each survey, the 3D digital model (Fig.1) and the reflectance maps of the test area.
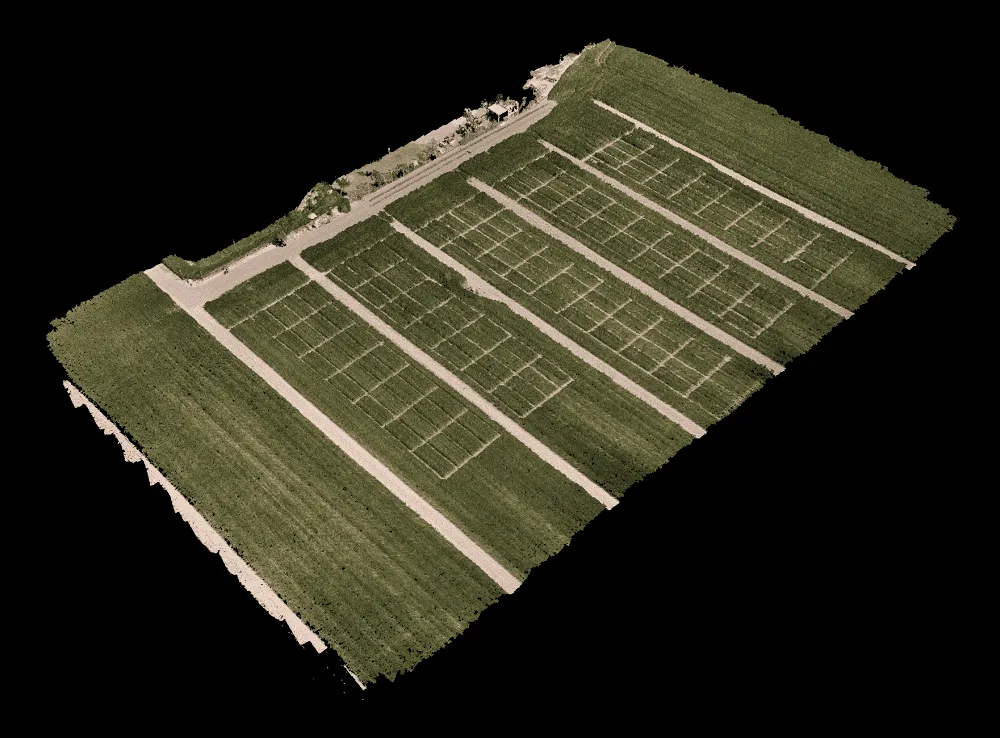
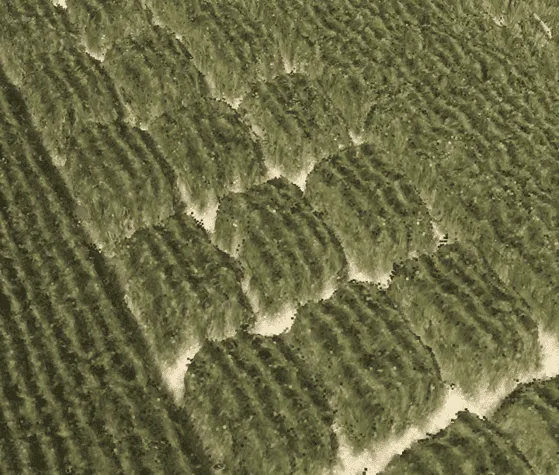
Fig.1: Multi-temporal survey of a wheat field: 3D point cloud of the test area with the various plots.
During each survey, the following were obtained for each plot: vegetated area, biomass volume and several vegetation indices (NDVI, NDRE, GNDVI). Through the multi-temporal surveys it was possible to have dynamic monitoring, making it possible to assess not only the differences between the various plots at each survey, but also to numerically measure the evolution of each individual plot over time, highlighting, for example, that some plots that started out “at a disadvantage” ended up with a larger surface area than others that started out with greater ground cover (Fig. 2).
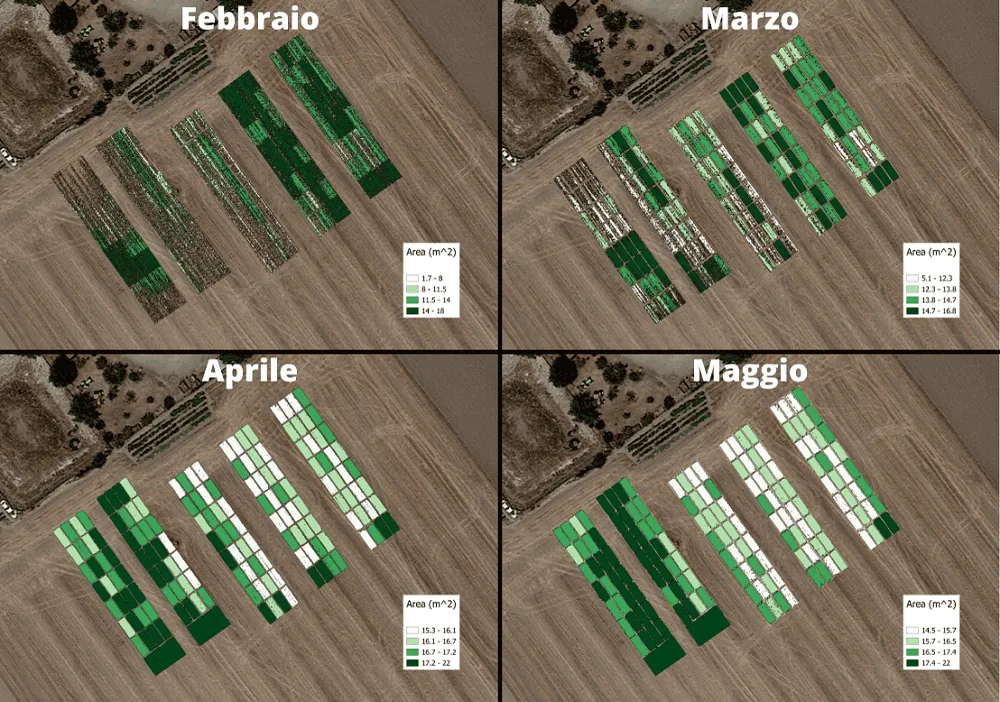
Fig.2: Multi-temporal survey of a wheat field: area covered by vegetation across the different surveys for each individual plot.
Similar analyses were carried out for biomass volume (Fig. 3) and vegetative vigour (NDVI index) (Fig. 4).
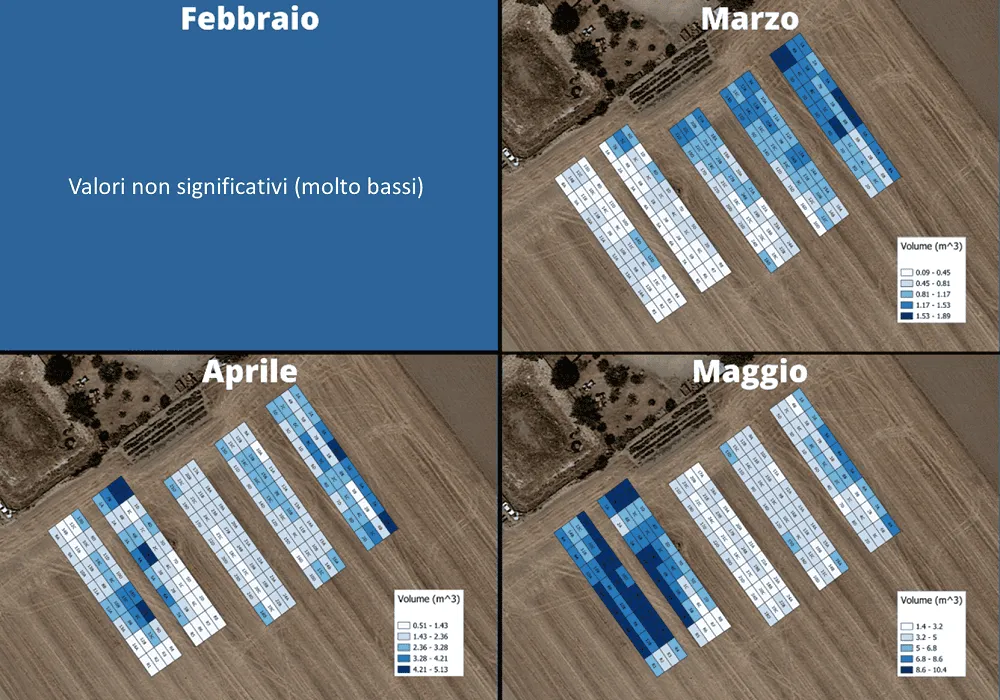
Fig.3: Multi-temporal survey of a wheat field: 3D point cloud and biomass volume map across the different surveys for each individual plot.
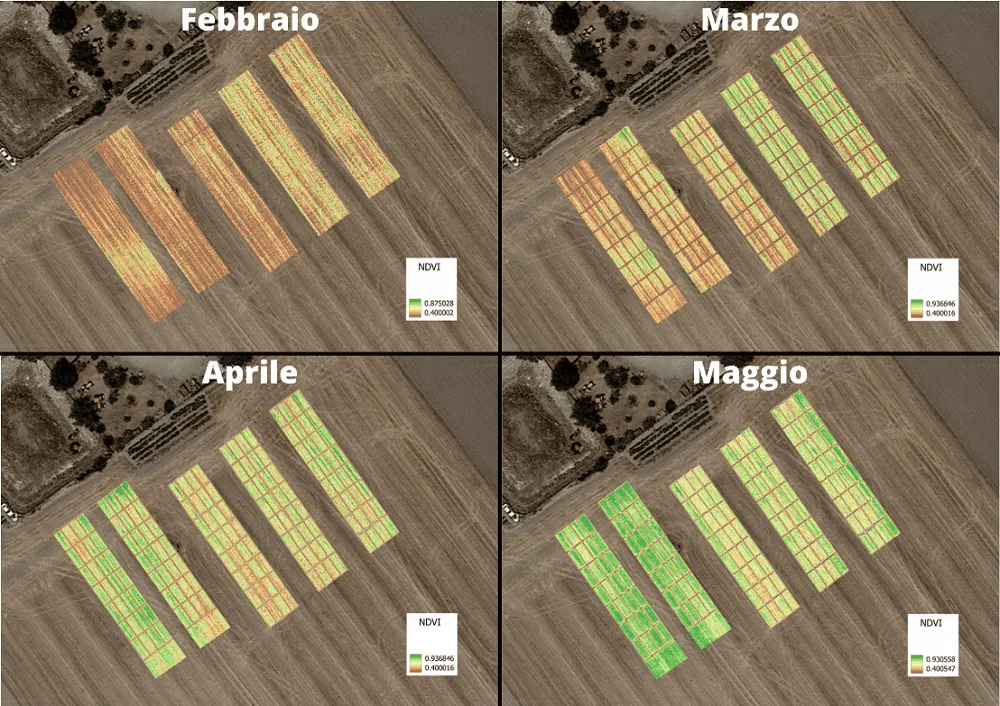
Fig.4: Multi-temporal survey of a wheat field: vegetative vigour (NDVI index) across the different surveys for each individual plot.
Conclusions
Thanks to the use of drone remote sensing and the processing of the data collected, it was possible to identify differences in the parameters analysed between plots at each flight, and through the multi-temporal surveys, it was possible to analyse and compare temporal variations in the parameters of the individual plots, such as growth, biomass volume and vigour.
For testing centres, multi-temporal drone surveys offer the ability to monitor how crops evolve over time, optimally and objectively assessing the development of individual plots in order to make the necessary assessments regarding the products tested, saving time on field measurements, which are nonetheless essential for finding correlations between drone data and ground-based data.
In conclusion, multi-temporal drone surveys provide a detailed and dynamic picture of field conditions over time, enabling farmers and technicians to make data-driven decisions and improve the efficiency, sustainability and productivity of their operations, allowing for timely and targeted interventions. By using multi-temporal surveys, farmers can assess the effectiveness of irrigation, fertilisation and resource management practices throughout the growing season. This allows them to optimise their use, avoiding waste and reducing costs.