How it works
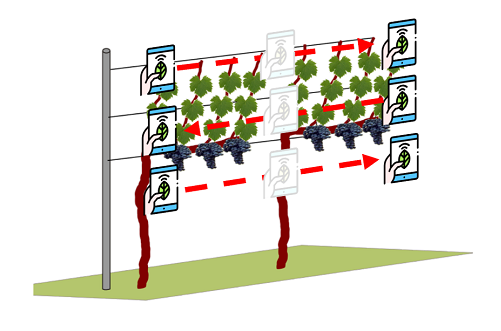
1. Scan a part of your row or an isolated plant (in case of non-row crops) with your smartphone.

2. Upload the captured photos to the cloud, even at a later time, and wait a few minutes for processing.
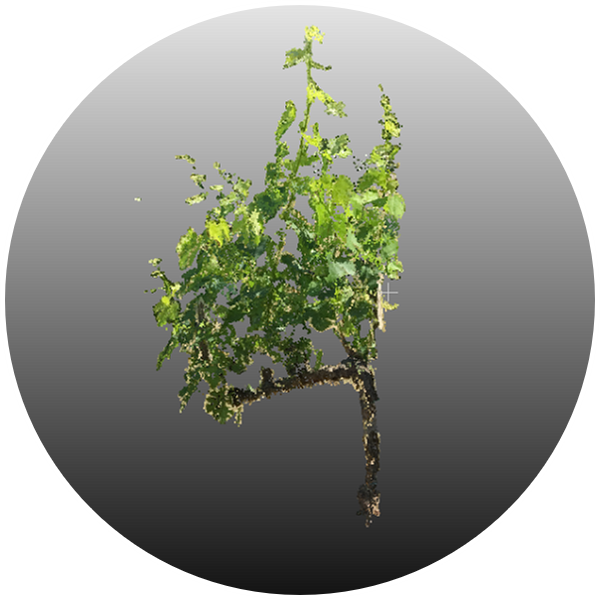
3. View the 3D model (point cloud) of the scanned part of the row or tree on your smartphone.
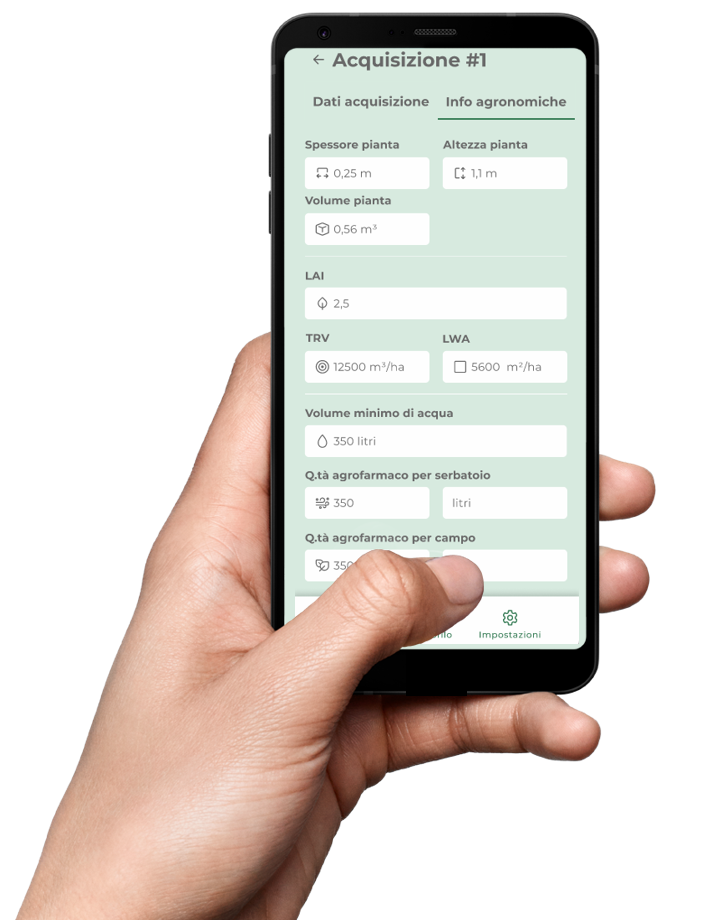
4. View results: canopy thickness, height and volume, LAI, LWA, TRV, optimal water dose for treatments.
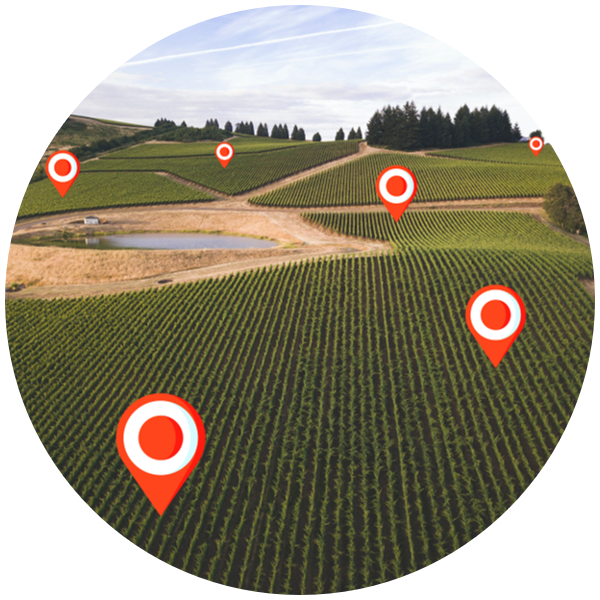
5. Repeat the scans at a sufficient and well-distributed number of points in your field (min. 5 points per field).

6. Complete all field scans within a maximum of 5 days to obtain correct results.
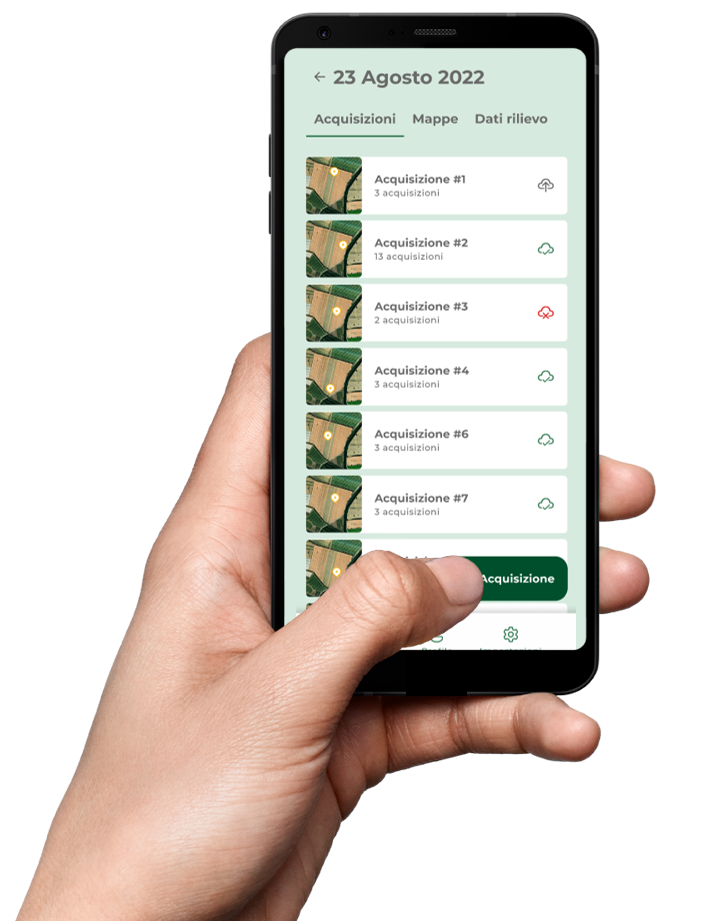
7. View and share the numerical results of each scan made within the same survey.
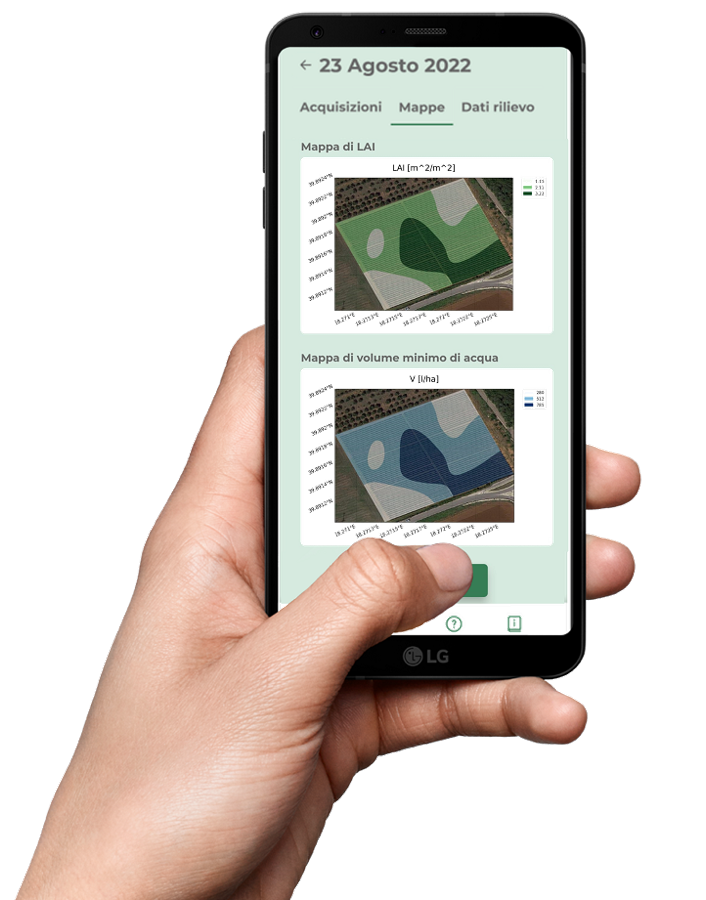
8. View and share maps of vigor (LAI) and optimal water dose for treatments for each survey made.
Subscription plans
Free
- 1 production unit
- Up to 1 ha
- More than 10 crops
- Up to 10 scans
- Export report
Basic
- 1 production unit
- Up to 5 ha
- More than 10 crops
- Up to 100 scans
- Weather forecast
- Spraying windows
- Export report
- Remote onboarding and support
- In-field onboarding*
Farmer
- 1 production unit
- Up to 25 ha
- More than 10 crops
- Up to 500 scans
- Weather forecast
- Spraying windows
- Export report
- Remote onboarding and support
- In-field onboarding*
Professional
- 10 production units
- Up to 50 ha
- More than 10 crops
- Up to 1000 scans
- Weather forecast
- Spraying windows
- Export report
- Remote support
- In-field onboarding
Enterprise
- 25 production units
- Up to 100 ha
- More than 10 crops
- Up to 2000 scans
- Weather forecast
- Spraying windows
- Export report
- Remote support
- In-field onboarding
Prices shown are exclusive of VAT.
* service on request.
Bundles
Starter Samsung
- Samsung Galaxy S24 256gb
- 10 production units
- Up to 50 ha
- More than 10 crops
- Up to 1000 scans
- Weather forecast
- Spraying windows
- Export report
- Remote support
- In-field onboarding
Advanced Samsung
- Samsung Galaxy S25 256gb
- 10 production units
- Up to 50 ha
- More than 10 crops
- Up to 1000 scans
- Weather forecast
- Spraying windows
- Export report
- Remote support
- In-field onboarding
Starter iPhone
- iPhone 15 pro 256gb
- 10 production units
- Up to 50 ha
- More than 10 crops
- Up to 1000 scans
- Weather forecast
- Spraying windows
- Export report
- Remote support
- In-field onboarding
Advanced iPhone
- iPhone 16 pro 256gb
- 10 production units
- Up to 50 ha
- More than 10 crops
- Up to 1000 scans
- Weather forecast
- Spraying windows
- Export report
- Remote support
- In-field onboarding
Prices shown are exclusive of VAT.
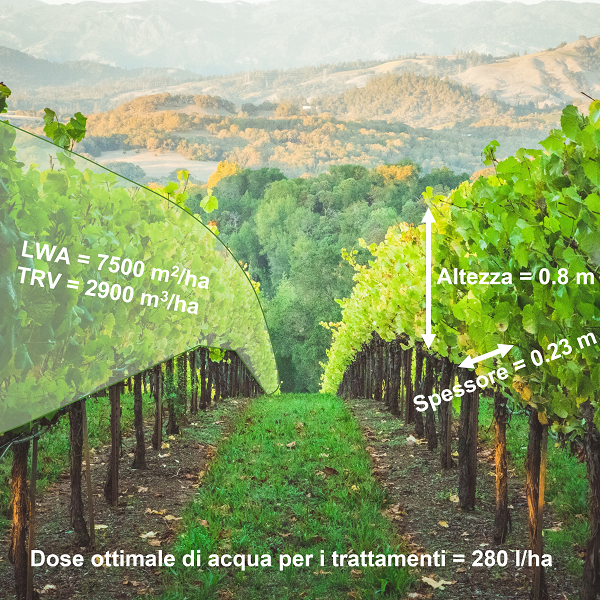
Through a photographic scan of a portion of a row or your tree via your smartphone or tablet, you can quickly and objectively measure:
– the height, thickness and volume of your plants
– the Leaf Area Index (LAI)
– the Leaf Wall Area (LWA)
– the Tree Row Volume (TRV)
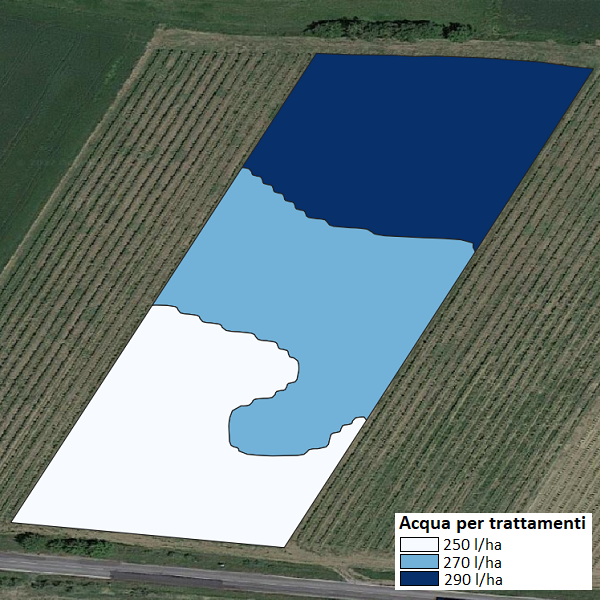
– the optimal dose of water for phytosanitary treatments for each area of the field and at each phenological stage
Super-local weather forecasts
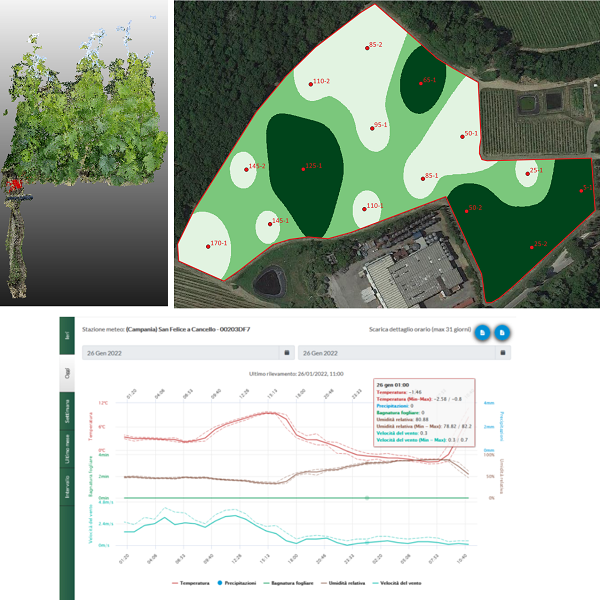
View super-local weather forecasts for up to 7 days of your plot. You will be able to see sky conditions, minimum and maximum temperature, air humidity, wind speed and direction, and the amount of rain that has fallen for the current day and the next 6 days, without having to install any sensors in the field. In addition, you will also be able to consult tri-hourly day-by-day spraying windows with which you can decide the best time to enter the field and carry out phytosanitary treatments.

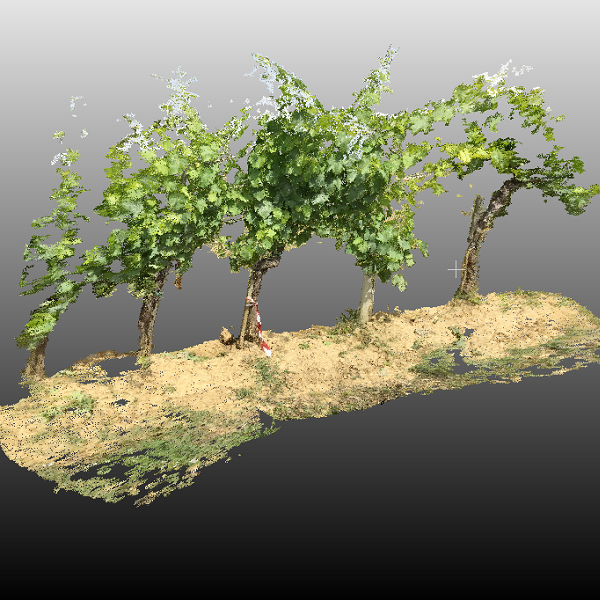
3D Models
Digitize your crops and historicize the data to always have them at your fingertips over time. The iAgro app allows you to create digital twin models (digital twin) of your crops that you can inspect even long after field acquisition. By repeating the surveys over time, you can create an evolutionary history of the acquired data and make better decisions in the long term.
Vigor maps and identification of variability
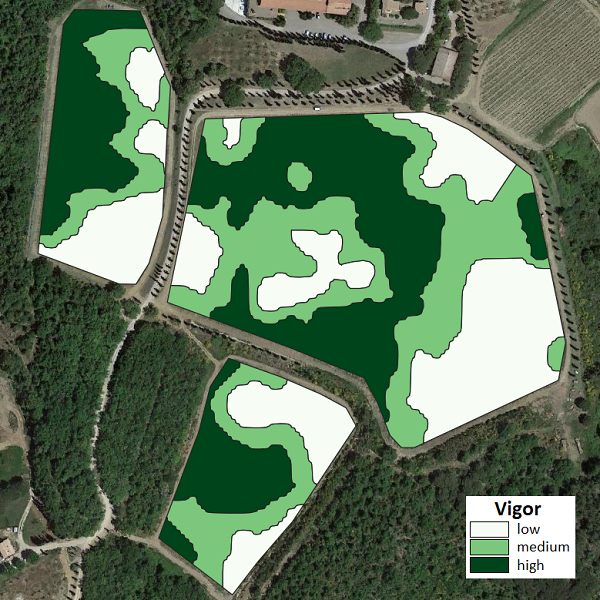
Create your own precision agriculture maps directly with your smartphone: sample a sufficient number of points and well distributed in the field (at least 5 points per field) and generate vegetative vigor maps (LAI index), for optimize fertilization, water and fruit harvesting.
Manage your plots of land in a way that site-specific, anticipates threats to yield and quality, saves chemical inputs and focuses resources only where they are most needed.
Create the story of your plot
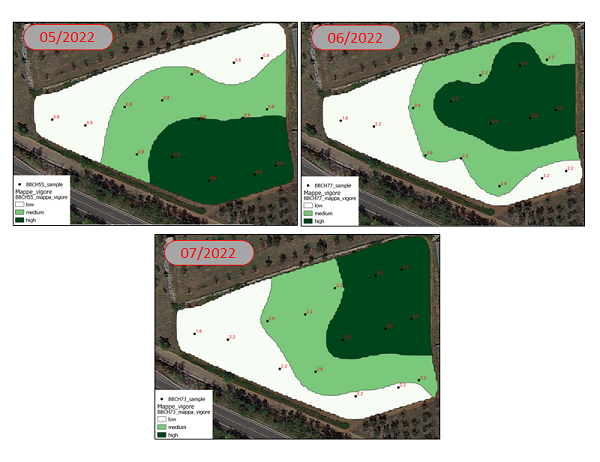
Conducts multiple surveys over time to create a time history Of your plot of land. You will be able to Compare over time the temporal evolution of your crops., both within the same growing season and between different growing seasons, having at your disposal objective and historicized data. Time maps will help you make better decisions to perform targeted interventions (e.g., fertilization) and to check whether differentiated treatments or fertilization have had the desired effects.
Optimized phytosanitary treatments
Communicate your commitment to sustainability
We help companies to communicate sustainability issues, by also developing marketing campaigns targeted for them. With the digital agricultural data and maps generated, you can communicate your commitment to the environment and society To customers and suppliers. Your customers will be able to have digital agricultural information about the final product they are consuming, be it wine, oil or fruit.
