iAgro Handbook
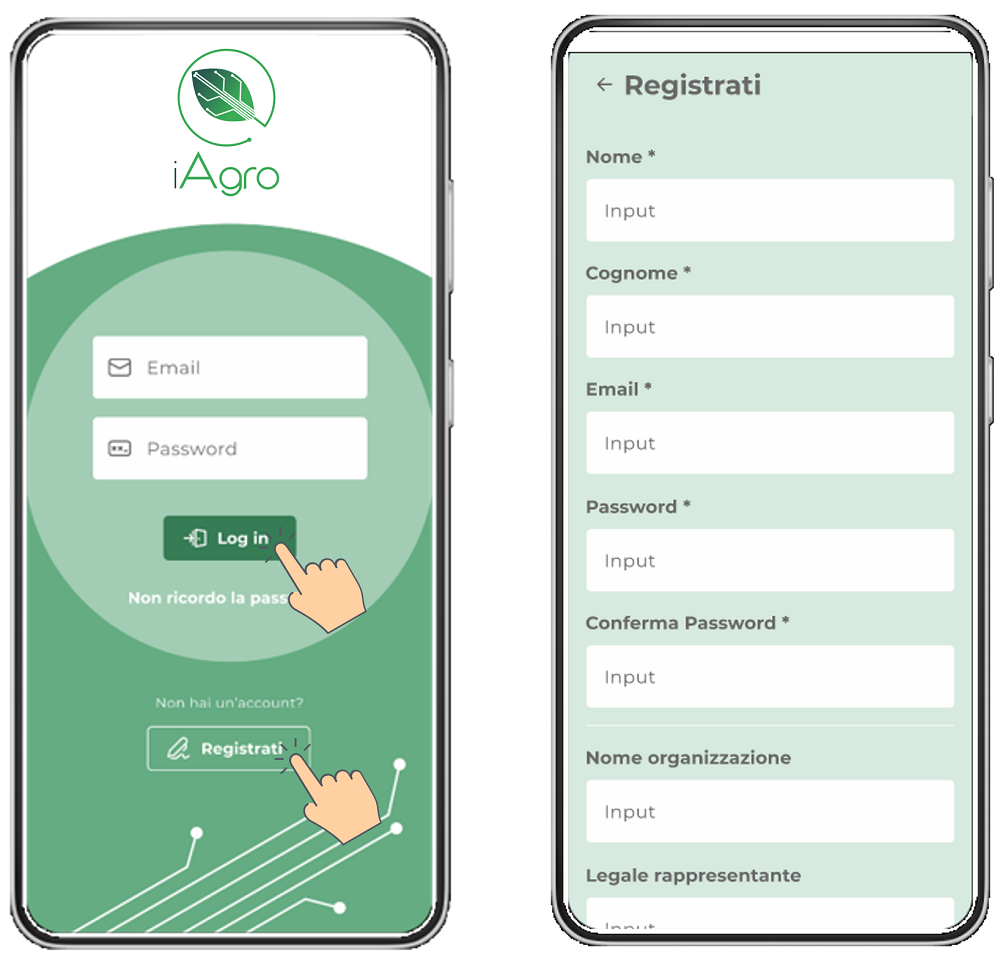
Login and Registration
To access the app, log in, if you have an account, or register by entering your private or company information. Upon completion of data entry and acceptance of the terms of services, you will receive a confirmation email for account activation.
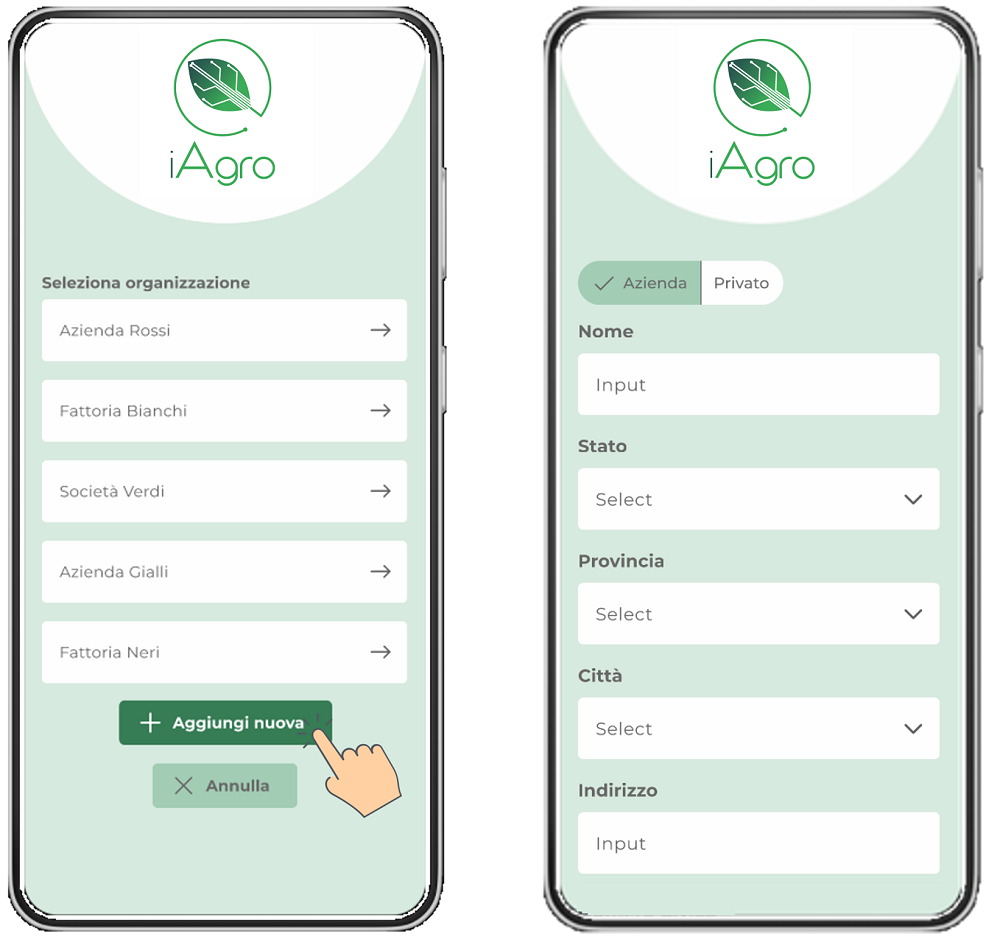
Create an organization
After logging in, first you need to create one or more organizations that will then be visible in the list.
Click on the “+ Add New” button and enter the required data (Company or Private).
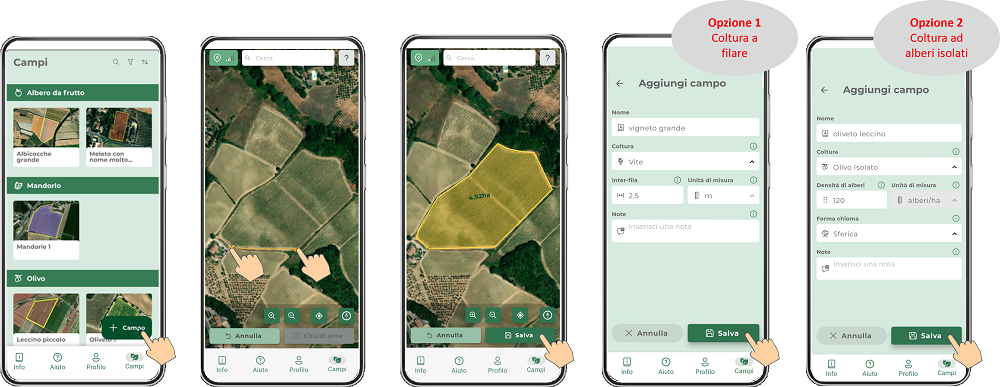
Create a field
Once the organization has been created, the first entity that will be found are the Fields.
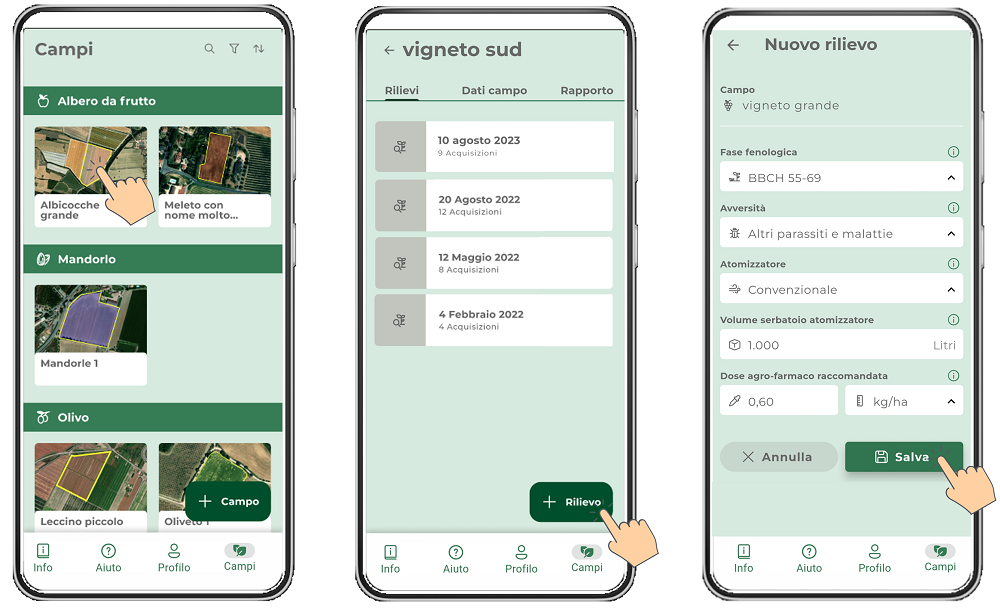
From the Fields panel you can see the fields that have been created and are available with an indication of the type of cultivation and with an image identifying the perimeter. To create a new field, simply click on “+ Field” and draw its boundary by hand, gradually adding vertices to the polygon. Once completed, click “Save” and enter the field data (name, crop type, row spacing). The row spacing should be included only in the case of typically row crops (e.g., vineyards) and for super-intensive plantings (e.g., super-intensive olive groves).
Create a relief
Having created the field, the second entity you will find is Reliefs.
To create a new Relief, access one of the fields in the list in the Fields panel and click on “+ Relief.” The screen that will open allows you to enter the data for the Survey (phenological stage, disease to be combated, type of sprayer, volume of sprayer tank, recommended dose(s) from label and unit of measurement of the latter).
Carefully follow the directions in the
tutorial
in order to perform the survey and acquisitions correctly.
Create an acquisition
Once the survey has been created, the third entity you will find is the Acquisitions.
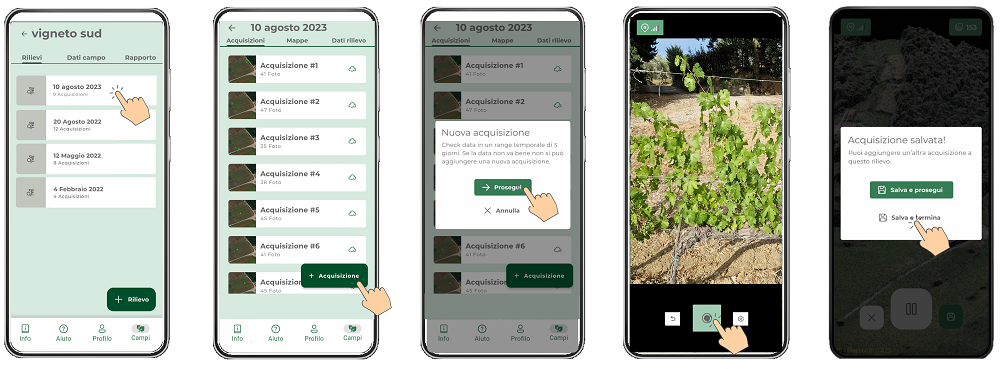
Once the Survey has been created and the first dataset of photos has been acquired, you can enter the individual survey from the Surveys panel. Within the individual survey you can see the list of Photo Acquisitions made and an indication of whether or not they were uploaded to the cloud for processing or if there was any error in processing.
From the list of acquisitions you can also create new ones by clicking on “+ Acquisition.” Going forward, an alert is displayed to warn the user that acquisitions of a single survey must necessarily be completed within 5 days of the creation of the survey in order not to mix acquisitions made at different phenological stages. Continuing on, you enter the capture screen, where the smartphone/tablet camera and GPS for geolocation will be activated. By framing the part of the row/tree to be scanned and clicking on the registration button, scanning will be started:
carefully follow the directions in the
tutorial
in order to correctly perform the scan
.
Once you have finished the acquisition, click on “Save and Continue,” if you want to go on to create a new acquisition, or on “Save and Finish,” if you want to finish and return to the list of Acquisitions.
Field Panel
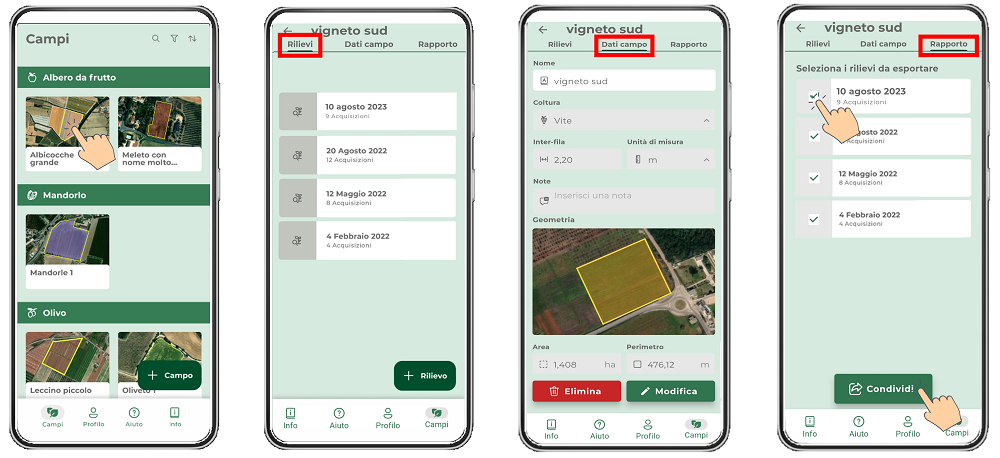
The individual Field panel has 3 sections: Survey, Field Data and Report.
Surveys
In this section you can see the list of surveys with date performed on the field in question and the number of acquisitions present in the individual survey.
Field Data
In this section you can see the field data entered by the user when it was created, i.e. the name, crop type, row spacing (if any), field perimeter and its area in hectares.
Report
In this section you can export in tabular format the results of the acquisitions made in all the surveys associated with the selected field. You can choose which reliefs to export, based on the given date. The exported excel sheet will have one page for each survey, and each page will contain a number of rows corresponding to the results of the acquisitions performed in that specific survey.
Panel Relief
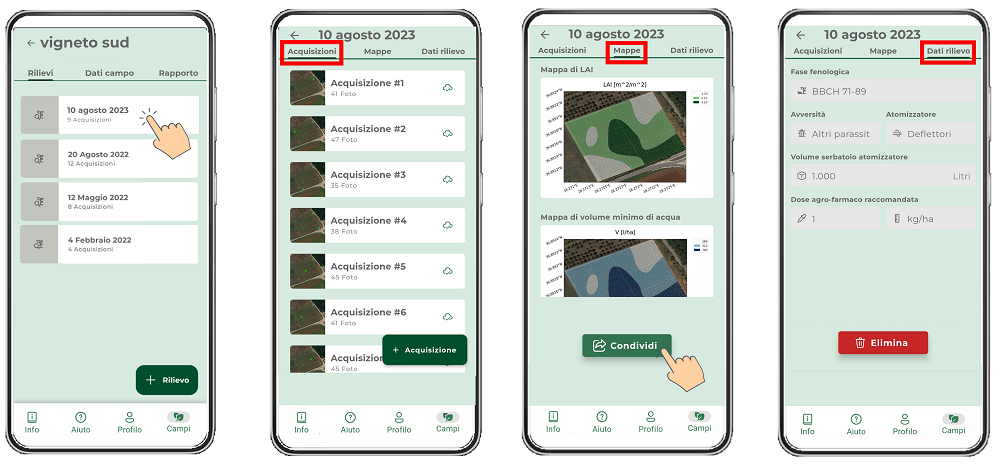
The individual Survey panel has 3 sections: Acquisitions, Maps, Survey Data.
Acquisitions
In this section, you can see the list of acquisitions performed for the survey in question, the number of photos in the individual acquisition and whether the dataset has been uploaded to the cloud and processed.
Maps
In this section you can
veed, download and export maps of the survey in question, which will be visible only when 5 or more acquisitions are made. They are available
the map of vegetative vigor (LAI index) and the map of optimal water dose for phytosanitary treatments in l/ha. All maps are made in 3 homogeneous zones and can be exported/downloaded in .jpg, .geotiff and .shp formats.
Survey data
In this section you can see the survey data entered by the user when it was created, i.e., the phenological phase, the disease to be combated, the type of sprayer, the volume of the sprayer tank, the recommended label dose and the unit of measurement of the latter.
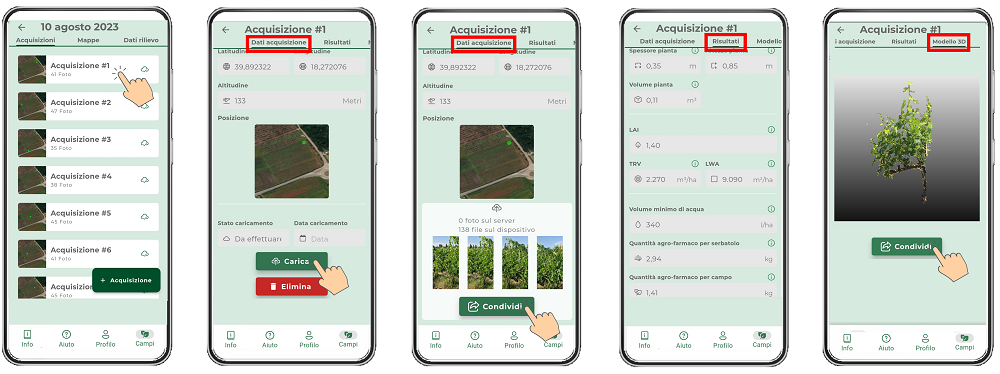
Acquisition Panel
The single Acquisition panel has 3 sections: Acquisition Data, Results, 3D Model.
Data Acquisition
In this section you can see the geographical location of the acquisition and upload the photo dataset to the cloud. In addition, it is possible to see whether the dataset has been uploaded and processed as well as, via the “Share” button, export outward captured photos that are present on the smartphone/tablet.
Results
In this section it is possible to see the results of this acquisition: the thickness, height and volume of the part of the row/tree analyzed, the vigor parameters LAI (Leaf Area Index), LWA (Leaf Wall Area), TRV (Tree Row Volume) and the optimal dose of water for phytosanitary treatments as well as the doses of agropharmaceutical to be placed in the sprayer tank and those that will be distributed in the field.
3D Model
In this section, the 3D point cloud of the scanned part of the row/tree can be viewed, navigated and exported outward.
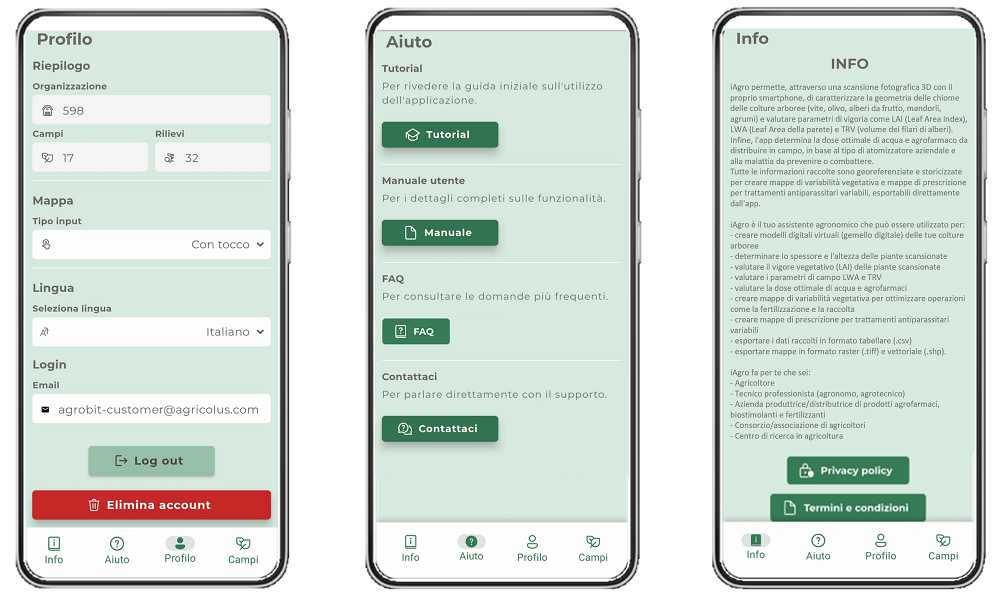
Profile, Help and Info Panels
The Profile section allows the user’s account information to be displayed, including the organizations they control and the total number of fields and surveys performed. You can select the language, change the organization if 2 or more have been created, invite other users to your organization, or log out or delete your account.
In the Help section you can view the tutorial, video tutorial, user manual, and FAQ, or contact us directly by email.
The Info section contains information about the iAgro app, as well as links to the “Privacy Policy” and “Terms and Conditions” pages.